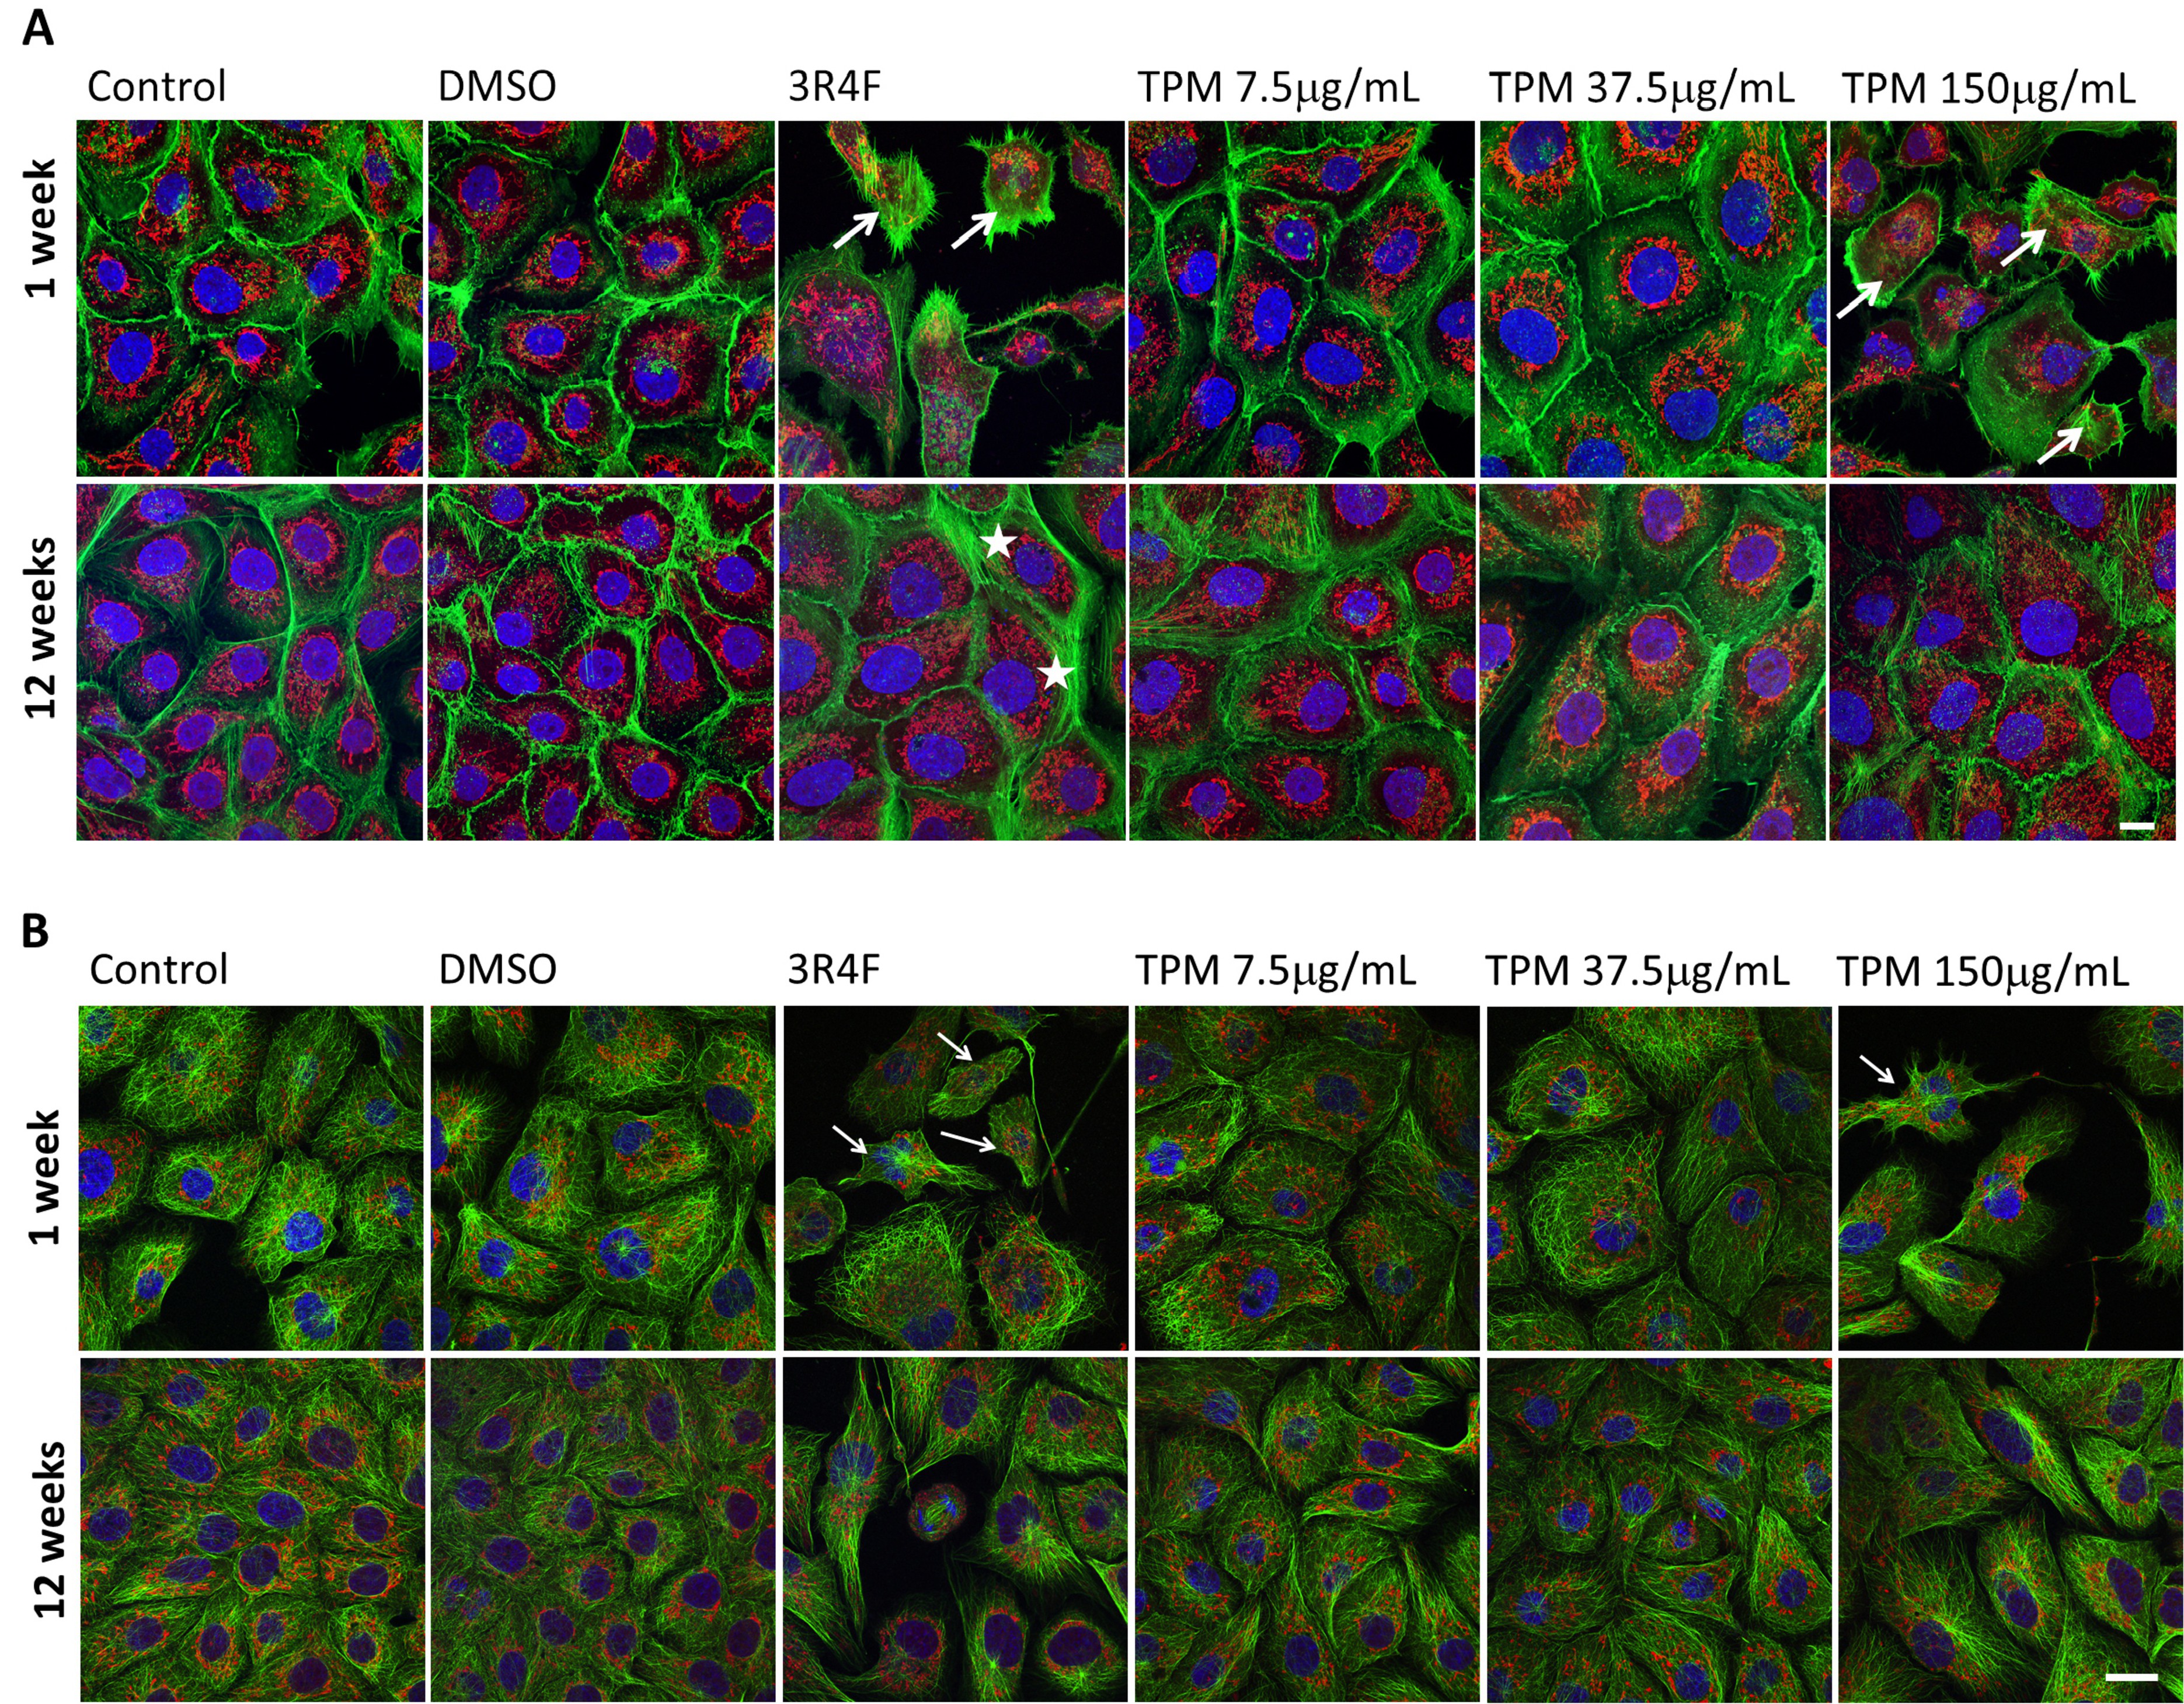
Fig. 2. Effects of one- and 12-week exposures of BEAS-2B cells to TPM from 3R4F reference cigarette smoke (7.5 µg/mL) and THS 2.2 aerosol (7.5 µg/mL, 37.5 µg/mL, and 150 µg/mL) on cellular morphology: (A) representative images of cellular architecture presented by actin filament staining (green), (B) representative images of cellular architecture presented by microtubules staining (green). Arrows - indicate distinct cells (shrunken cells), asterisks - clusters of stress fibers. Red, mitochondria; blue, nuclei. Scale bar represents 20 μm.